
[Theory] Matplotlib
Matplotlib
- Python 에서 사용할 수 있는 시각화 라이브러리
numpy와scipy를 베이스로 하여 다양한 라이브러리와 호환성이 좋다- 다양한 시각화 방법론
Import Library
1
2
3
4
5
6
7
import numpy as np
import numpy as np
import matplotlib as mpl
import matplotlib.pyplot as plt ## 매트랩에서 사용하던 시각화 도구

print(f'numpy version : {np.__version__}')
print(f'matplotlib version : {mpl.__version__}')
기본 Plot
Figure,Axes
matplotlib에서 그리는 시각화는 Figure 라는 큰 틀에 Ax 라는 서브플롯을 추가해서 만든다
1
2
fig = plt.figure()
plt.show()
차트 요소
subplot
1
2
3
fig = plt.figure(figsize = (12,7)) # 비율 조절
ax = fig.add_subplot() # subplot ax 추가
plt.show()
- figsize : 가로 세로 길이(inch 단위) 를 tuple 형태로 전달
2개 이상
1
2
3
4
fig = plt.figure()
ax1 = fig.add_subplot(1,2,1)
ax2 = fig.add_subplot(1,2,2) # 세로를 한칸, 가로를 2칸으로 나누었을 때 첫번째
plt.show()
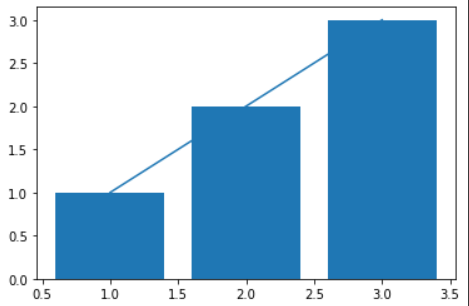
그래프
그래프
1
2
3
4
5
6
7
8
fig = plt.figure()
ax = fig.add_subplot()

x = np.array([1,2,3])
ax.plot(x) # ax 에 x 선그래프 그리기
ax.bar([1,2,3],[1,2,3])# ax 에 막대그래프 그리기

plt.show()
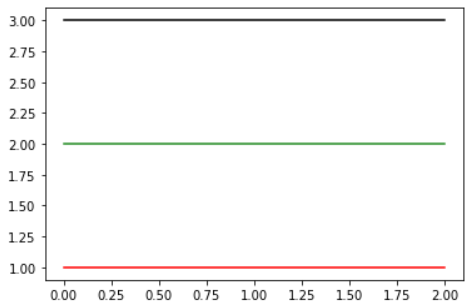
색상 지정
- color parameter 통해 전달
1
2
3
4
5
6
fig = plt.figure()
ax = fig.add_subplot(111)

ax.plot([1,1,1], color = 'r')# 한 글자 색상
ax.plot([1,1,1], color = 'forestgreen')# 색상 이름
ax.plot([1,1,1], color = '#000000')# hex code
텍스트
1
2
3
4
5
6
7
8
9
10
11
12
13
14
15
16
17
18
19
20
21
22
fig = plt.figure()
ax = fig.add_subplot(111)

ax.plot([1,1,1], label = '1')
ax.plot([2,2,2], label = '2')
ax.plot([3,3,3], label = '3')

ax.set_title('Basic Plot') # 타이틀 추가
ax.legend() # 범례 추가

ax.set_xticks([0, 1, 2]) # 축에 적히는 수 위치
ax.set_xticklabels(['zero', 'one', 'two']) # 축에 적히는 텍스트

ax.text(x=1, y=2, s='This is Text') # 일반적인 텍스트
ax.annotate(text='This is Annotate',
            xy=(1, 2),
            xytext=(1.2, 2.2),
            arrowprops=dict(facecolor='black'),
           ) # 화살표 추가 가능

print(ax.get_title())
plt.show()
- ax 에서 데이터 변경 시 set_~() 의 메서드가 많이 쓰인다
- set~() : 세팅 get~() : 값 불러오기